A dashboard can help boards of directors pay attention monthly to key indicators of financial health. This dashboard review can occur in between the quarterly monitoring reports on the board's "financial conditions" policy. A dashboard is intended to supplement, not replace, monitoring reports; those reports are the place for more detailed information about the key indicators and the longer-term trends.
With a dashboard, the general manager or chief executive officer provides useful and understandable information in a concise format, focusing on just a few key indicators. Managers typically manage many more levels of detail than the board needs to see as they work to understand the overall state of the business; just as with the dashboard in your car, these financial dashboards should not include too many indicators.
Suggested monthly indicators
The key indicators listed in the sample below are suggestions for a basic dashboard for a food co-op:
• The first three indicators in this sample—sales, sales growth, and net income—focus on the top line and bottom line of the income statement;
• MML (margin minus labor) and EBITDAP (earnings before interest, taxes, depreciation, amortization, and patronage refunds) highlight high-level measures of operational effectiveness and efficiency;
• current ratio and days of cash derive from the balance sheet.
Sometimes a dashboard may include other indicators related to a turnaround plan or other specific goals. Your own dashboard will work best when the board and general manager or chief executive officer have an agreement about which indicators to include—and a shared understanding of why they matter.
Monthly dashboard
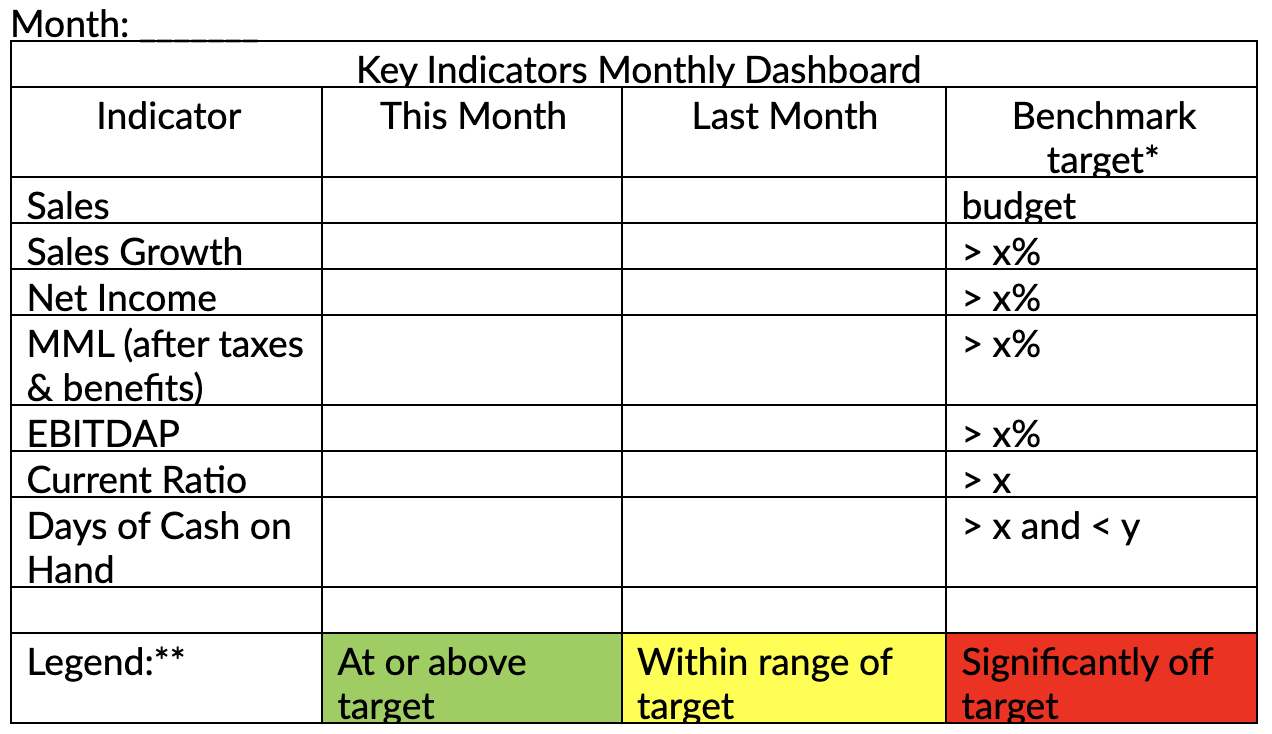
*The benchmark targets should ideally come from some objective expert advice about what makes sense for your business. National Co+op Grocers can be a good source for benchmarks that make sense for retail grocery co-ops, though your co-op may have a reason to use other sources.
**Each cell in the "This Month" column would be highlighted with the color corresponding to the legend. This provides a very visual cue about which data points to focus on.
Related Resources

Michael Healy
Governance & Leadership Development
michaelhealy@columinate.coop
802-881-7306
Have more questions?
Get in touch with one of our consultants.